


dLogit: a hackathon project revisited
INTRODUCTION
Diabetics need a better way to journal because the current options are too time consuming and inaccurate. Keeping track of blood sugar readings, writing down all food eaten, noting exercise and medication dosage is a lot of work for diabetics. For their medical team, this information is vital to developing a care plan that reduces complications and optimizes health. I have a family member that lives with diabetes, so I've observed the challenges first-hand.
The Team And My Role:
I was the team lead and recruited team members during the month leading up to the two day cultivateHealth Hackathon, so that we could begin the research and branding phase of the project pre-event. Based on my past hackathon experiences, I knew it was vital to begin the research phase pre-event. By the time the hackathon began, the team consisted of 8 members with backgrounds in design, development, marketing and content strategy. On the second day of the hackathon, a team member and myself presented dLogit to attendees and judges.
Following that weekend, I was notified we made it to the next phase in the competition. We presented to executives at Sendero Health Plans, with the chance of a supported beta launch on the line. While the team completed a product website and mobile prototype at the hackathon, I chose to revisit this project independently to fill in gaps created by time constraints. The artifacts below were created independently during my studies at ACC.
Our Process: Design Thinking
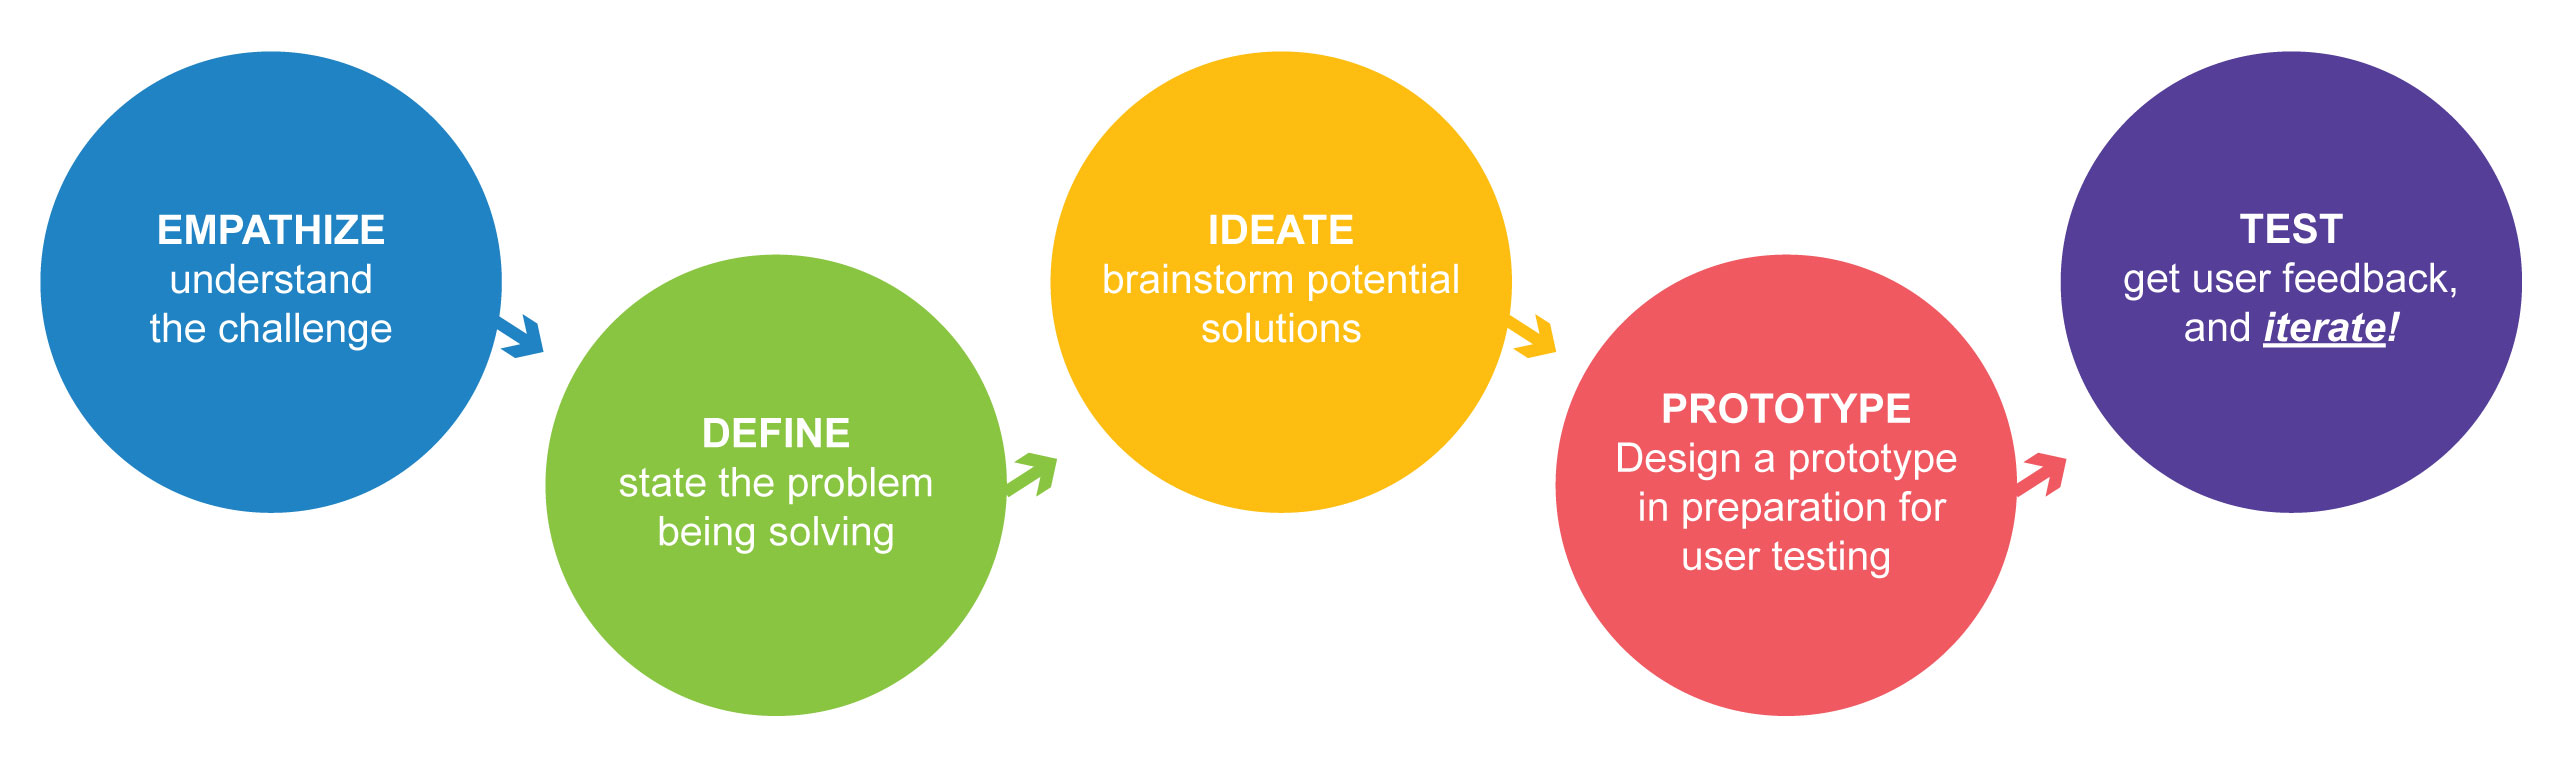

LEARN
Research & Discovery:
- Data and reports from the Texas Health and Human Services, U.S. Census Bureau and Latino Healthcare Forum
- Comparative analysis
- Competitive analysis
- Contextual observation
- Interviews with diabetics, members of the Austin Rundberg community and healthcare providers
- User participation in whiteboarding at the hackathon
As I developed the Research Plan, I used data from the above sources to determine who to reach out to. As an experiment, I independently interviewed two diabetics and created empathy maps in collaboration with them. Although this was not how I was taught to create an empathy map in my studies, I thought it might be an interesting way to engage interviewees in the UX process. One was completed pre-hack, and the other at the hackathon itself.
Our research indicated that the population living in the Rundberg area had mobile phones with internet access. This was important to consider as we explored what form the solution should take. It was noted that users had mobile devices, but did not own home computers. We chose to focus on Android, as they have a lower consumer price point, and comparative analysis revealed an attractive opportunity and need compared to iOS.
It was clear there was not any one app recommended for journaling. Patients were frustrated because it was too time consuming to journal their necessary medical data throughout the day. Doctors and nutritionists were frustrated because they needed accurate medical data to develop effective care plans.


Who:
The cultivateHealth hackathon focused on the Rundberg area of Austin, a low-income population where diabetes is ranked as the second highest health issue. According the Centers for Disease Control and Prevention, 29 million diabetics live in the United States, and that number is expected to increase.
Diabetics experience a myriad of complications daily. Our interviewees shared stress, and anxiety during sessions. In some cases, they were living with other health conditions caused directly by diabetes that could not be reversed. All acknowledged the importance of maintaining as normal of blood sugar levels as possible to reduce health complications.


PLAN
Analyzing our research led us to focus our solution on empowering diabetics with an accurate method of logging that’s easy to use, and provides easy sharing options with their healthcare team. After synthesizing our research and conducting competitive analysis, we decided on an Android mobile app.
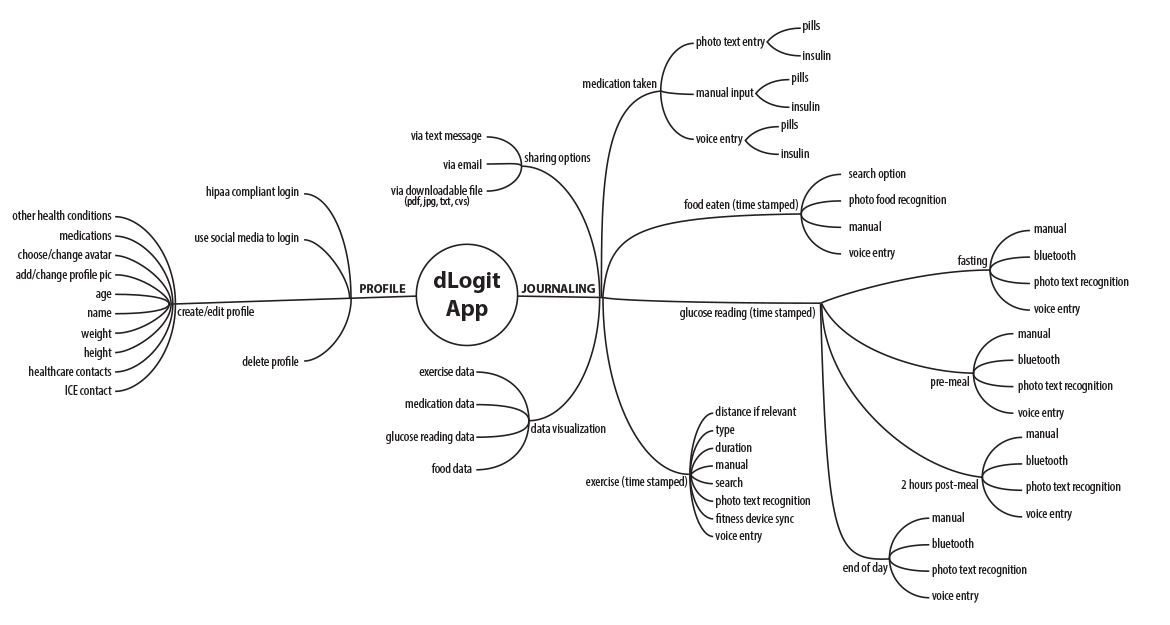
Information Architecture:
I used a mind mapping technique to explore the areas of the app. This offers a quick way to get ideas out for consideration, while also providing a visual. Research, competitive analysis, and comparative analysis helped me identify how to structure content. User interviews and usability testing helped shape categorization of content.

MAKE
Wireframes:
Photo-food recognition is one key innovation and differentiator from competing products. This technology empowers users to photograph a plate of food using their phone’s camera, and record the nutritional values into their journal. It uses image data, contextual clues, volume estimation, and a nutritional database to accomplish this in seconds. This would particularly prove valuable when dining out or at holiday meals, when diabetics indicated they struggled the most with estimating accurate nutritional information.
Key product features include:
- Android focus - high usage among our user-base
- Photo-food recognition
- Voice-text recognition
- Photo-text recognition
- Accurate nutritional data pulled from the USDA National Nutrient Database for Standard Reference Open API
- HIPAA compliance
- Gamification
Prototype:
My process began with studying fitness and food journaling apps, Amazon's photo-search recognition, and medical devices such as glucometers and continuous glucose monitors to gain inspiration. During this point, I sketched quite a bit on paper or post-its (one screen per post-it). Post-its were limited by size, but provided great portability and let me quickly re-arrange flows on the go. Something that's important when you're a student, and not sitting near whiteboards!
I later created the digital wireframes in Sketch, and used InVision to build out the interactive prototype for user validation. This allowed me to easily share it, and I could send testers a prototype link directly to their phones.


TEST
Usability Testing:
Initial testing was conducted with a diabetic user on-site. It indicated a need to refine the UI, and explore more detailed data visualizations. The participant expressed excitement regarding the concept, and looked forward to the beta release, as it would help him more accurately journal for his doctor. After the initial round of testing a mid-fidelity InVision prototype, I revised the UI and data visualizations. The wireframes above reflect those changes.
NEXT STEPS
The next phase will focus on building out more user flows for testing using InVision. The end goal is to continue to refine the prototype to offer users a concise, accurate, and delightful experience.
A later phase will include creating a Spanish language version, as it’s ranked second in languages spoken in the Rundberg region of Austin.

